The Charcoal Scourge
MONITORING CHARCOAL PRODUCTION SITES IN SOUTHERN SOMALIA THROUGH SATELLITE IMAGERY
Background
In the wake of more than 20 years of civil unrest, environmental information for Southern Somalia is scarce. Nevertheless, there is clear evidence that the war economy is rapidly depleting the country’s natural resources - especially the woody biomass. Despite a UN ban on charcoal exports from Somalia, large quantities are transported each year to the Arabian Peninsula. Charcoal production is wiping out valuable trees and seriously degrading Somalia’s fragile environment.
Wood charcoal production is one of the most important businesses supporting warring groups such as the Islamist group Al Shabaab, which ruled Southern Somalia from 2006 to 2012 and is still occupying large areas. Continued Al Shabaab activity prevents anyone from entering the zone to understand precisely what is happening. For this reason, the monitoring and assessment of charcoal production had been carried out remotely by SWALIM, in collaboration with the Joint Research Centre (JRC) of the European Union and the University of Twente (ITC) of the Netherlands.
Charcoal production in Somalia
In Somalia, charcoal is produced in ‘kilns’, a type of oven. The timber of cut trees is piled up, covered with iron sheets, and buried with sand (Fig.1). After the oven burns for up to a week, the sand and sheets are removed and the timber has turned into charcoal, which is put in bags and transported to harbours along Somalia’s coastline. All that is left is a dark circle on the ground made of ash from the precious cut trees (Fig.2).
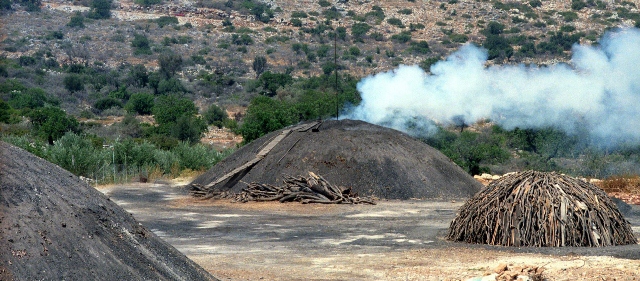
Figure 1 – Charcoal kilns made of piled up trees, as seen on the ground. The kiln on the left is already active, while the trees piled up on the right will be covered by iron sheets and sand in order to form a kiln.
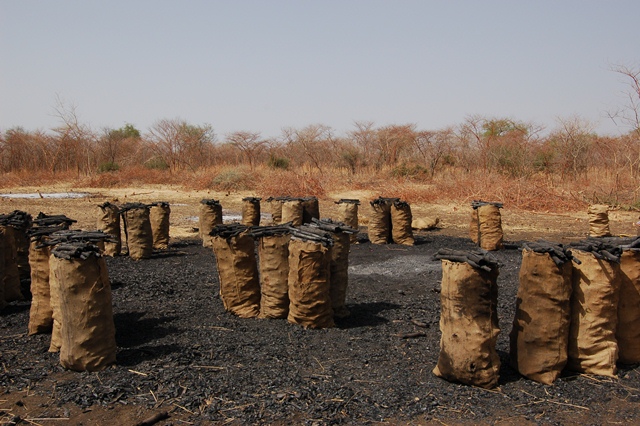
Figure 2 – Bags of charcoal at the production site. The ashes remaining on the ground create a circular black spot, which is clearly detectable with very high resolution satellite images.
Detecting charcoal production with satellites
These circles can be seen by very high-resolution satellites, such as WorldView-1 (Fig.3 and 4). By defining a few rules for colour, size, and shape, the software operated by SWALIM could automatically identify production sites over a 4,700-square-kilometer wooded area along the Juba River in Southern Somalia. By comparing images from 2011 and 2013, it was possible to determine, with a high level of precision, where and how much charcoal was produced (Fig.5 and 6). It was also revealed that this production is expanding into new areas, eating up ever more trees and speeding up the degradation of the environment. The results of the analysis are crucial for better understanding the dimension and impact of the charcoal production trade.
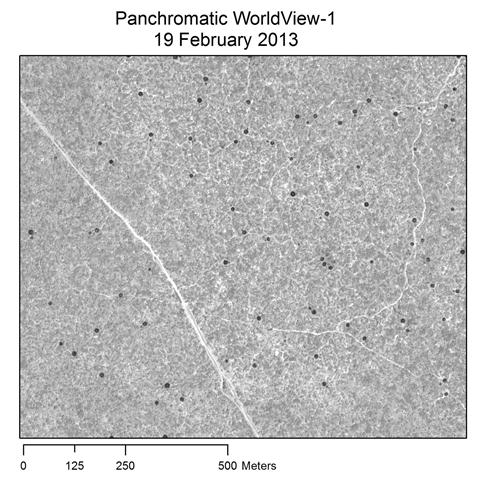
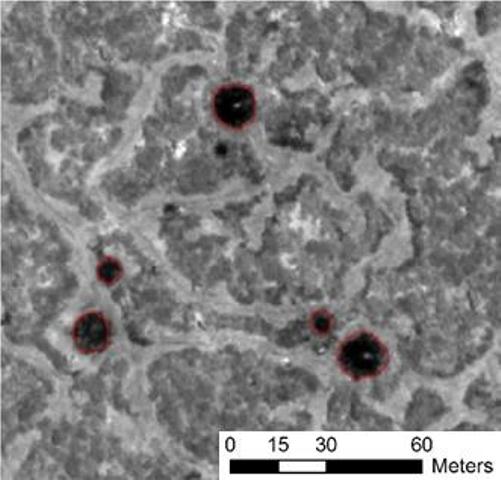
Figure 3 - Example of charcoal site detection on a satellite image. The black dots are charcoal production sites.
Figure 4 – Detail of Fig.3 showing an example of charcoal production sites automatically detected on a WorldView-1 image.
Next steps
The SWALIM exercise was the first study to assess large-scale charcoal production changes in Somalia. It pointed to the need for on-going monitoring of charcoal production at the national level. This would allow an assessment of Al-Shabaab’s movements related to the illicit trade and increase our understanding of which other groups profit from the charcoal business. The increased availability of affordable high-resolution images puts such a national system within reach.
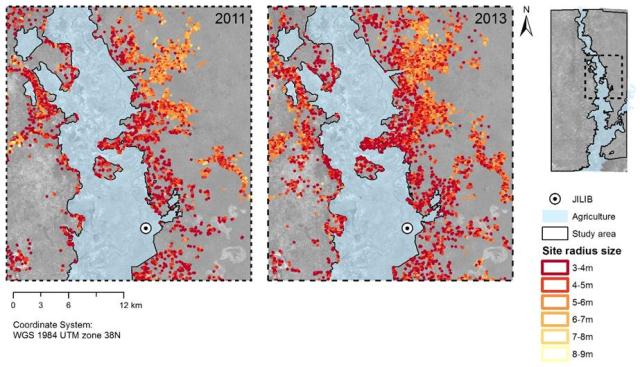
Figure 5 – Expansion of charcoal production towards more remote areas near the town of Jilib. The blue area indicates an agricultural area without charcoal production.
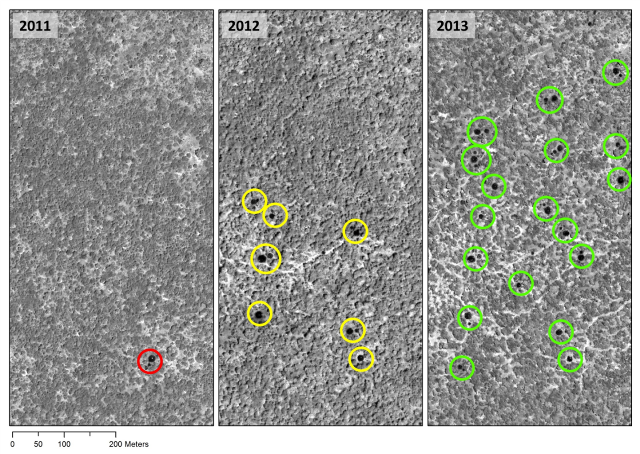
Figure 6 – Satellite images showing a subset of the study area in 2011 (left), 2012 (centre) and 2013 (right). The dramatic increase of charcoal production sites (circles) is clear, bringing with it an irreversible land degradation process.
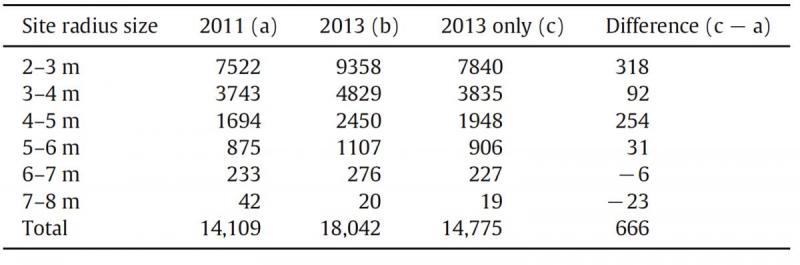
Table 1 - Number of detected sites grouped by size. Sites detected in 2013 views, and not on 2011 views, are reported under the “2013 only” column.
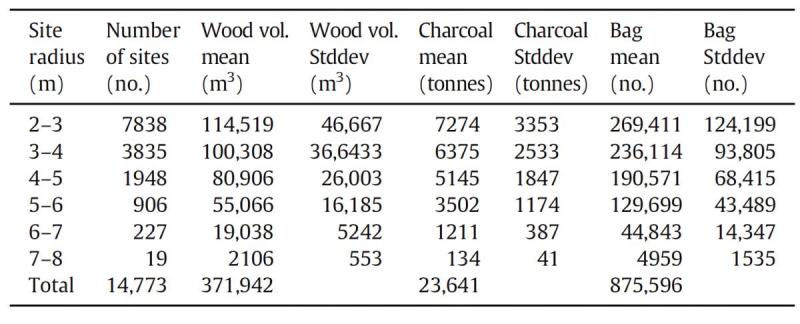
Table 2 - Estimate of wood volume used and charcoal produced after March 2011. Values in the table refer to sites identified uniquely on 2013 views (not detected on 2011 views). To determine the mean and standard deviation, all combinations of assumed low/high values for dry wood, charcoal production, and charcoal bags produced were used.
Best Authentic Sneakers | nike roshe tiempo vi fc black purple blue hair